

NYC Foreclosures: A Tale Of Two Cities As Bronx And Staten Island Peak As Brooklyn Foreclosures Drop
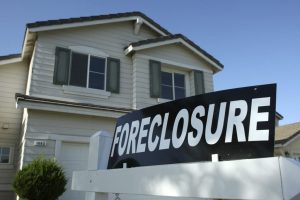
Behind a deceptively mild citywide downtick of NYC foreclosures, borough foreclosure markets pulled into significantly diverging paths. Brooklyn foreclosure cases were nearly halved. Yet, the Bronx hit a record high. Meanwhile, Queens remained unchanged and Staten Island surged back up and Manhattan cooled slowly.
Key Takeaways:
NYC foreclosures inch down 3% year-over-year totaling 399 first-time cases in the first quarter of 2026
Lis pendens remain nearly flat. They ticked down 1% to 1,538 filings.
Brooklyn foreclosures fell 45% for slowest quarter since mid-2022
Manhattan foreclosure activity continues to level off after Q3 record peak
Queens logs 167 first-time filings — more than Manhattan, Brooklyn and Staten Island combined — despite remaining nearly flat year-over-year
Staten Island foreclosure activity more than doubles to highest figure since mid-2022
Bronx foreclosure sector marks most active post-pandemic quarter with 67 first-time filings
Two-family and condo foreclosures drop with Brooklyn slowdown, while Staten Island and Bronx accelerations push single family filings upwards
NYC Foreclosures: Bronx And Staten Island Foreclosures Rise
The NYC foreclosure market started 2026 with a slight decrease in the first quarter by coming in 3% below year-ago levels with 399 first-time filings. Pre-foreclosures also ticked down, albeit by a negligible 1%, to total 1,538 lis pendens. Notably, this marked Q1 2026 as the slowest first quarter in three years, both in terms of NYC pre-foreclosures and foreclosures.
Granted, this tempered start to the year may already reflect the recent New York Court of Appeals ruling on the retroactivity of the Foreclosure Abuse Prevention Act, but it also covered up much more nuanced and wide-ranging market dynamics at the borough level.
Brooklyn (62 foreclosures) presented the most dramatic change after a 45% drop in filings brought it to its lowest activity since mid-2022. Manhattan (45) also trended down, but at a much milder 17% as it continues to cool off after its historic peak in Q3 2025.
At the opposite end of the spectrum stood the Bronx (67), which closed its most active post-pandemic quarter following a 24% year-over-year (Y-o-Y) increase in filings. Staten Island was on the rise, too, shooting up 123% Y-o-Y for the highest number of foreclosures since mid-2022.
Meanwhile, Queens (167) remained flat, but continued as the most active foreclosure market in the city. In fact, it surpassed the combined caseload of Brooklyn, Manhattan and Staten Island.
Pre-foreclosure trends were more balanced among the boroughs and had far less-drastic dynamics. Even so, one of the more significant changes was the 31% Y-o-Y increase in Manhattan lis pendens (68), but that rise still represented only 16 additional cases. Notably though, within each borough, foreclosure and pre-foreclosure trends completely opposed each other.